
Managing Design operations
GEP provides an AI-driven end-to-end Supply Chain Management (SCM) platform. The foundation of GEP applications is the Minerva and AI platform. The platform provides the application access to standard backend services and a shared user-interface component library.
GEP decided to build a design system by extending the material UI library in 2023 to move all the existing applications to the GEP NEXXE.
Responsibilities and Contribution
Ensure platform UX compliance
Align product and platform roadmaps
Check feasibility of solutions for new ideas
Provide guidelines for using the design system and microcharts
Conducted in-depth user survey sessions with key stakeholders to understand their needs, issues, and expectations for the dashboard.
Role
UX Designer Lead in managing this process on behalf of the platform UX team
Methods
Design System, Product Thinking, Interactive prototype, Sketching, Stakeholder Meeting, Experience Mapping, Mockups
Team
2 Senior UX Designers, 1 Senior UX Director, Engineering Manager, 2 Product Managers
Problem Statement
When I joined the platform UX team in 2021, the GEP NEXXE design system was in its adolescence. Existing GEP products were used to being ad hoc, and a lack of an integration process was felt. We wanted to significantly reduce the duplication of development efforts and promote consistent design language.
Solution
To achieve this goal, we introduced a review process as a service from the platform team. Product teams can schedule a review at different stages of a product lifecycle.
Through diligent study, I identified the requirements of users and irregularities in design, joining forces with Project Managers, platform engineers, and platform Product Managers to gain valuable insights. In the phase of definition, we agreed upon design norms. During the creation stage, I partnered with them in prototyping and verifying components for user-friendliness and growth. Eventually, in the delivery stage, we fine-tuned and applied the system across our offerings, ensuring uniformity and alignment with our company objectives.

Result
40+
platform UX reviews led
50+
recommendations consolidated for design system
$3.9M
Saved per year by reducing costs
Design Systems Contributions
#1 Making digital copy consistent
An outcome from our Platform UX inspection indicated inconsistency in the UI copy across product interfaces. Historically, there were no specified content creators within our product team. In addition, we were missing a digital copywriting specialist in our platform design team.

Consolidate application design screens and leave feedback via comments in Figma for two months
Copy comments and cluster them as per different UI components
Form copy recommendations for each UI component in easy-to-understand points
Provide these recommendations as part of internal UX guidelines on Confluence with visual examples and best practices.
Enhancement
We initiated a non-synchronous procedure to combine our initiatives.
Through every examination, we were capable of collecting the nuanced characteristics of each element. Below is the UI copy improvements in the Empty State component.
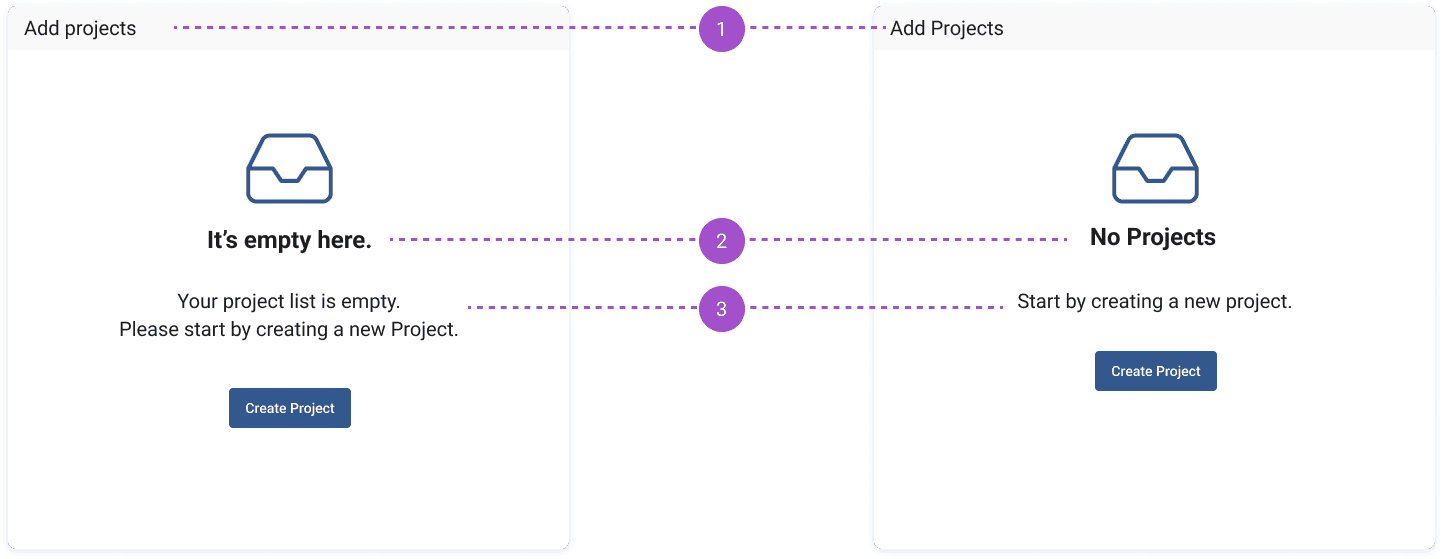
Before
Irregular Capitalization.
General statement lacking user-related details.
Long-winded explanation with a surplus of remorsefulness.
After
Uniform typography
Message heading related to the situation
Brief explanation using proper punctuation and a straightforward tone
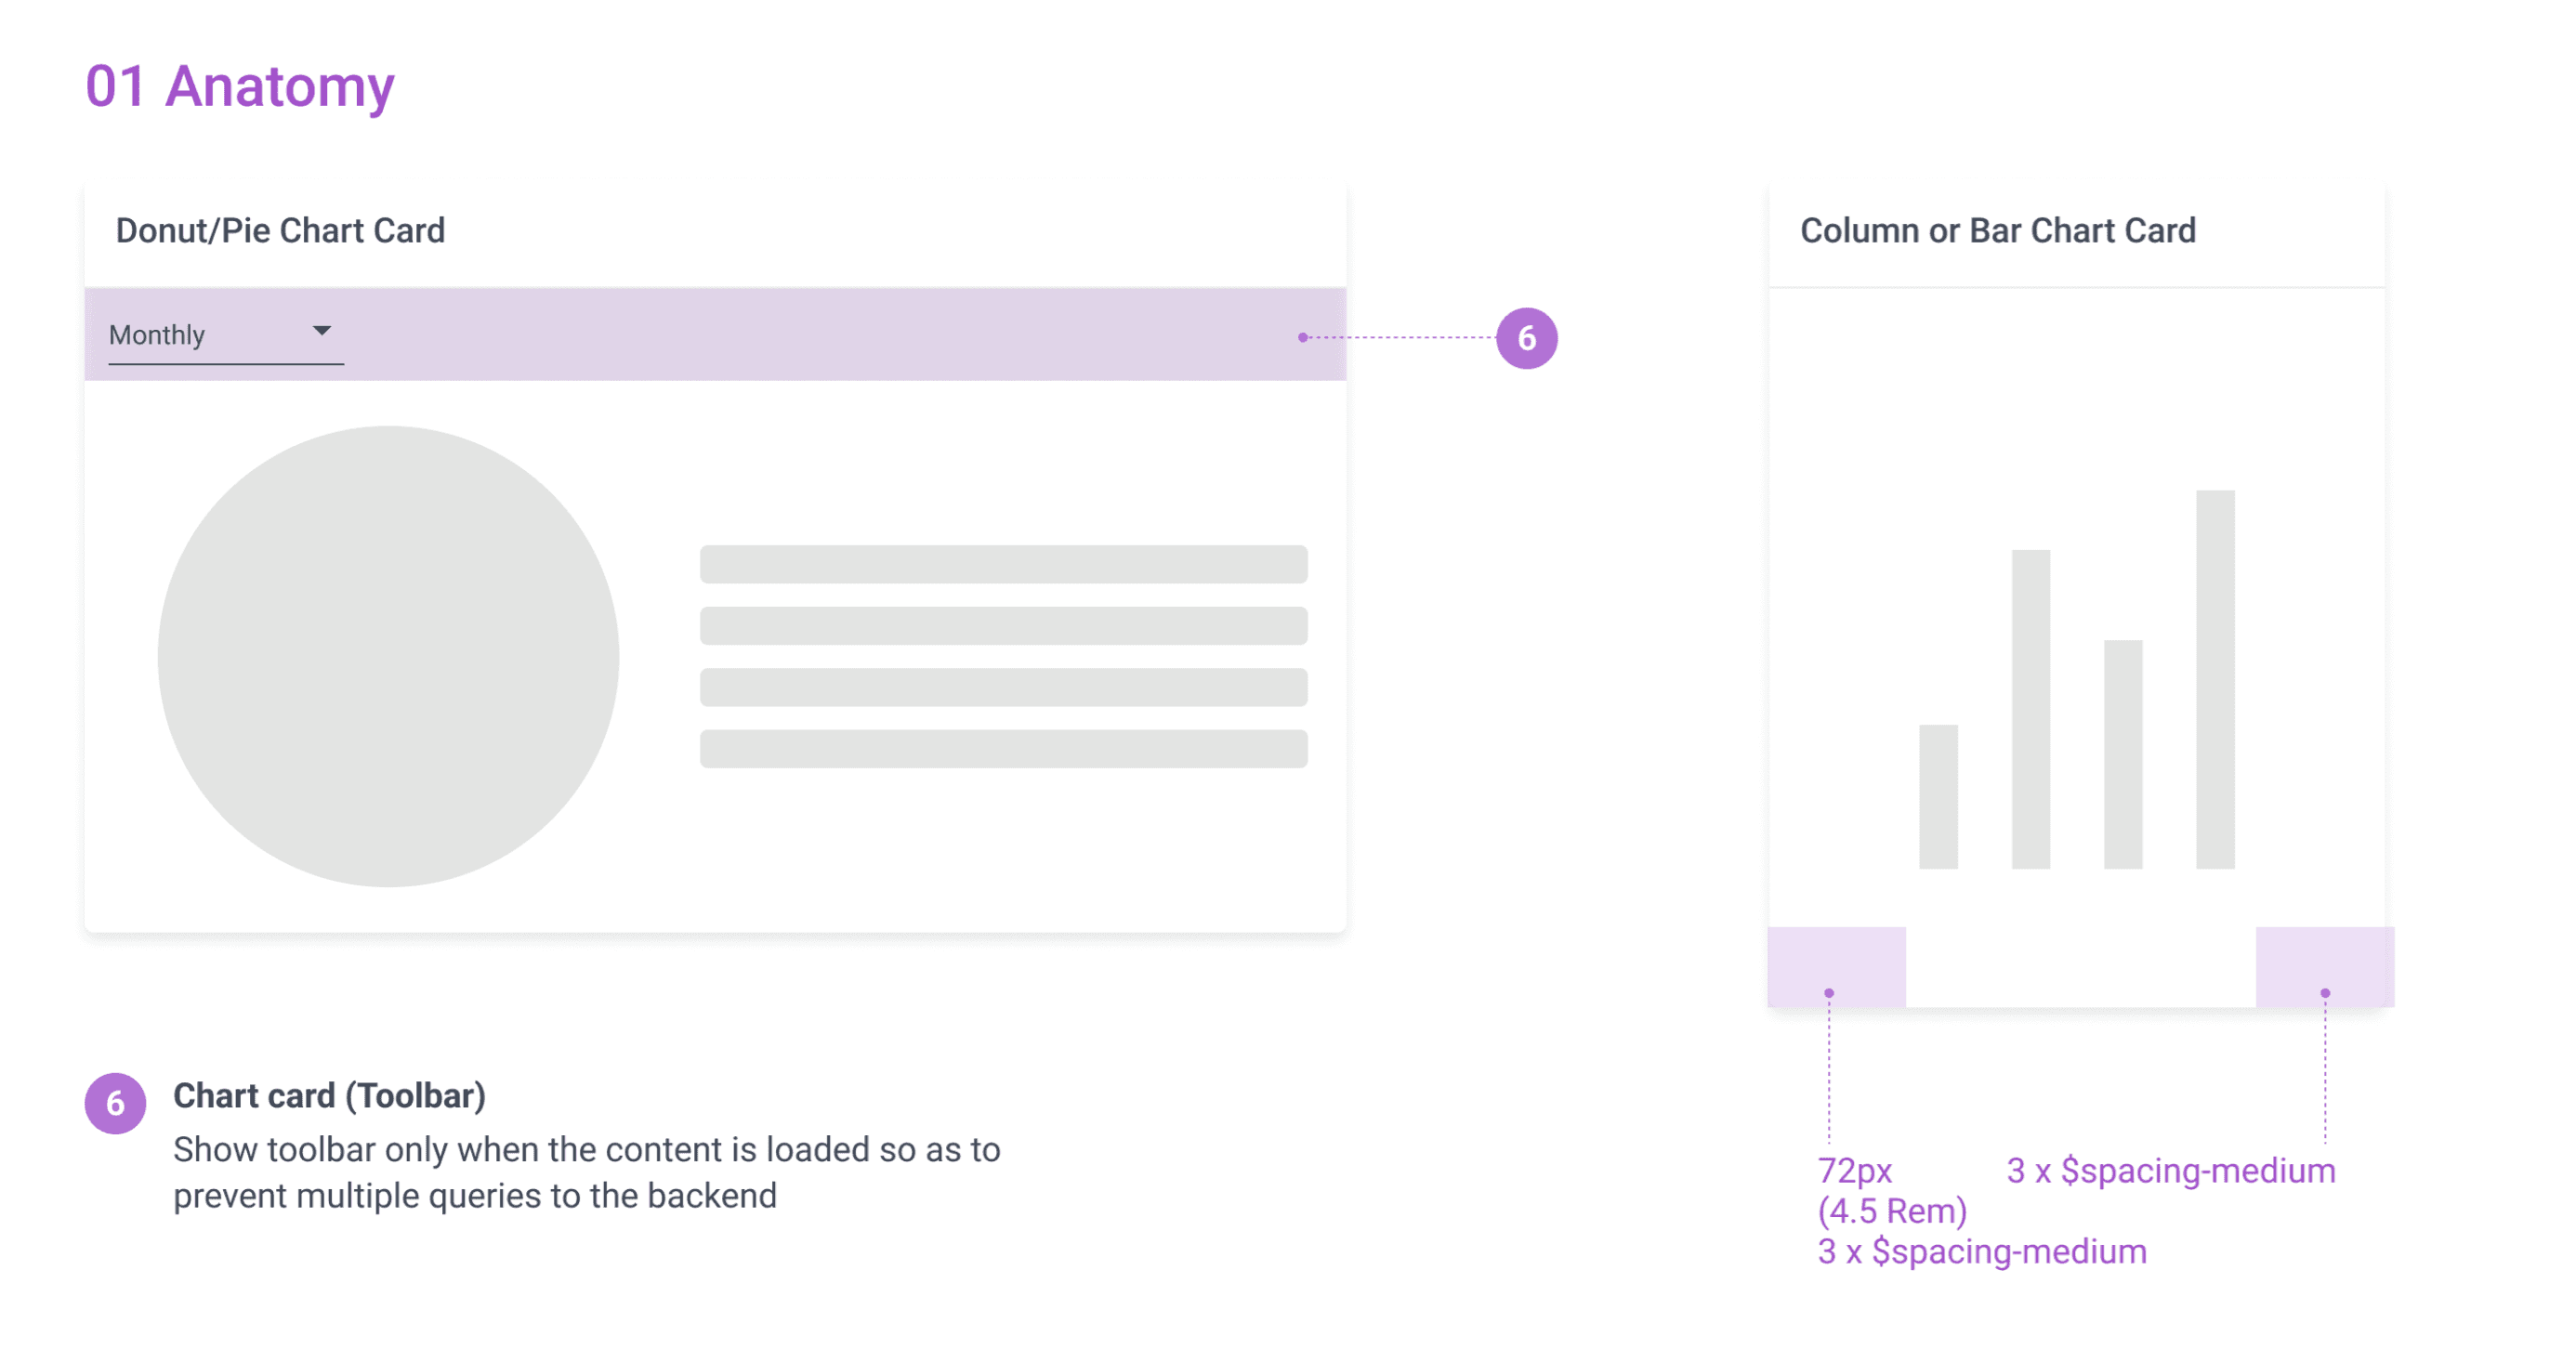
#2 Boosting perceived speed through the use of skeleton loading
Within the framework of the apparent performance project, our design team studied ways to combat extensive load durations. During this undertaking, I delved deeply into the following theories.

Microcharts
Platform Microcharts
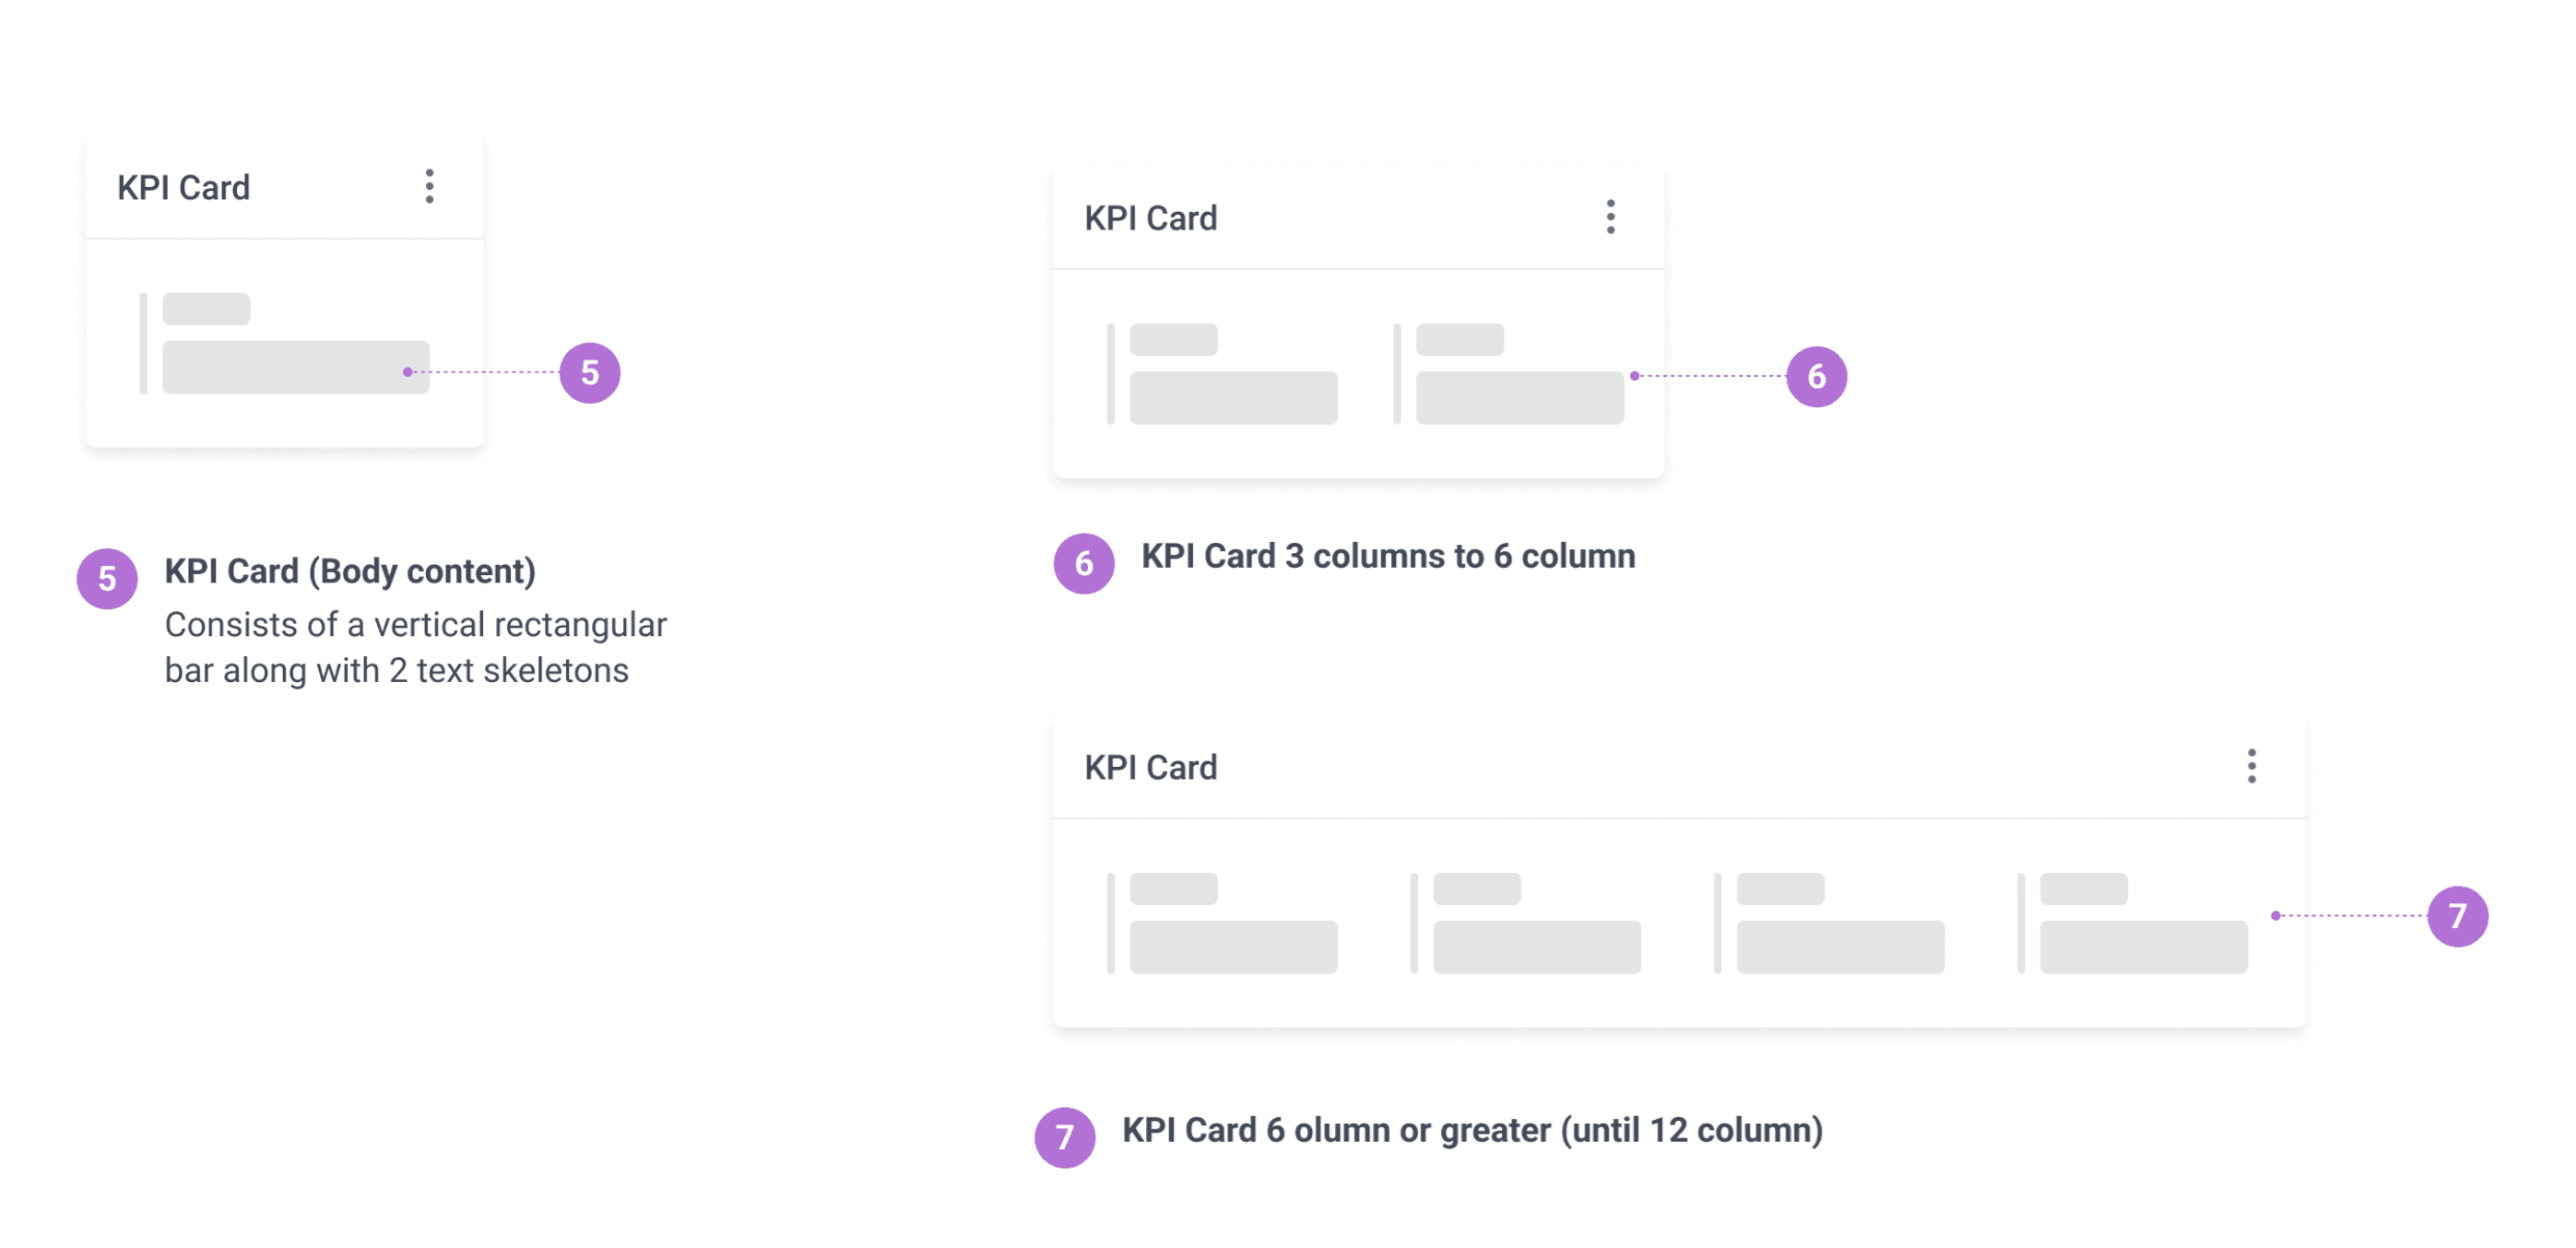
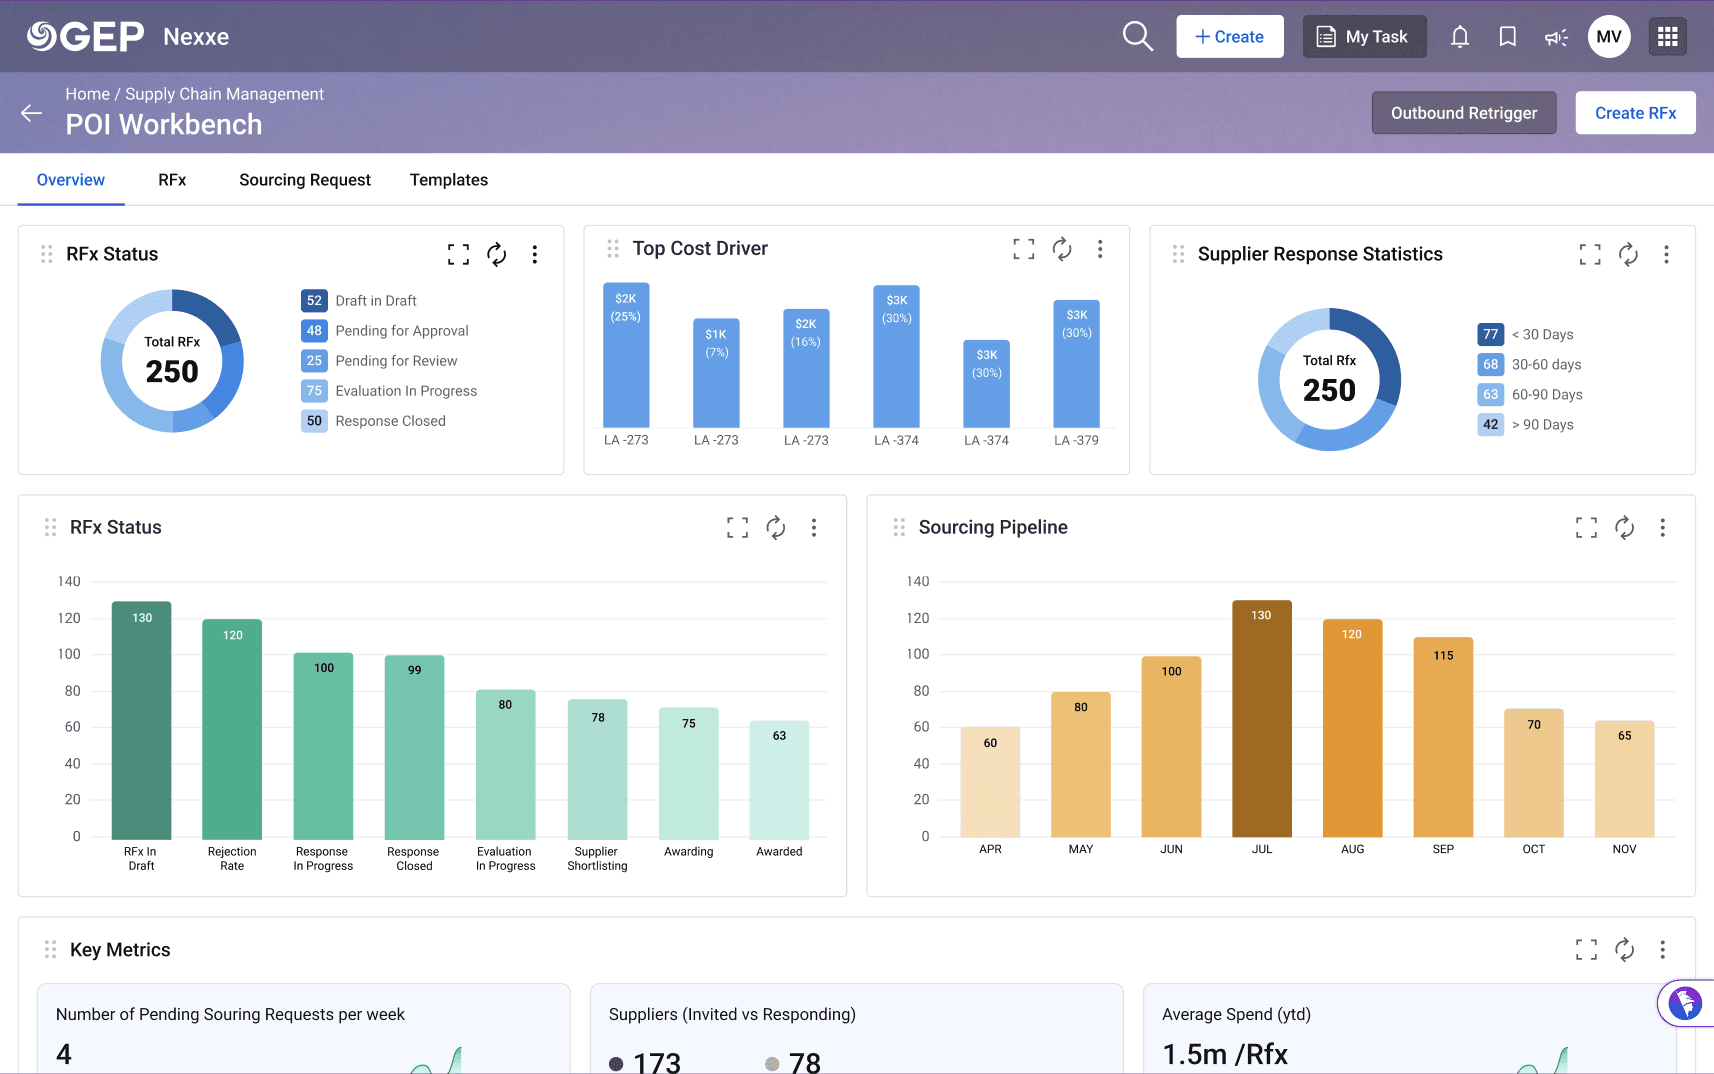
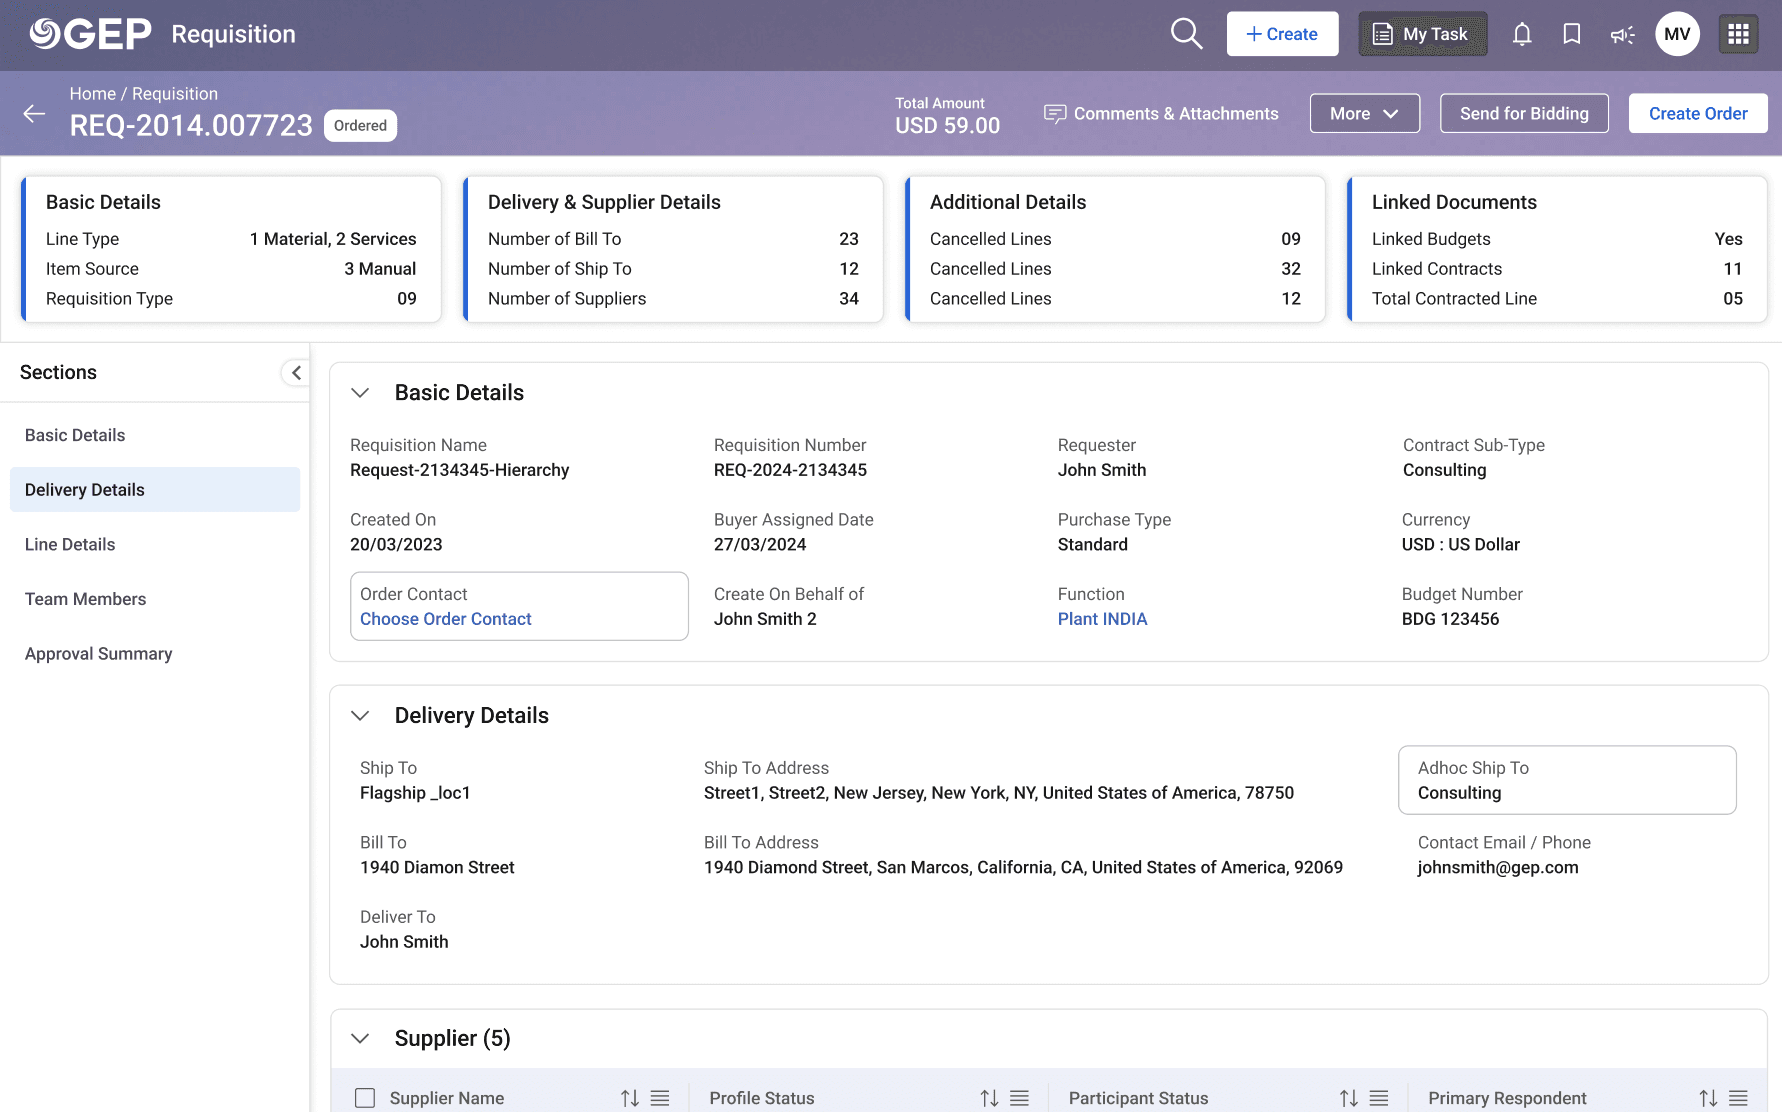
Microcharts assist in illustrating a minimal range of data points with compactness and clarity. We've flawlessly incorporated an array of these microcharts into our GEP NEXXE Platform library, thereby enhancing user interface across various applications. These elemental components blend effortlessly into broader UI sections such as tables, lists, headers, KPI controls, and forms.
Overview
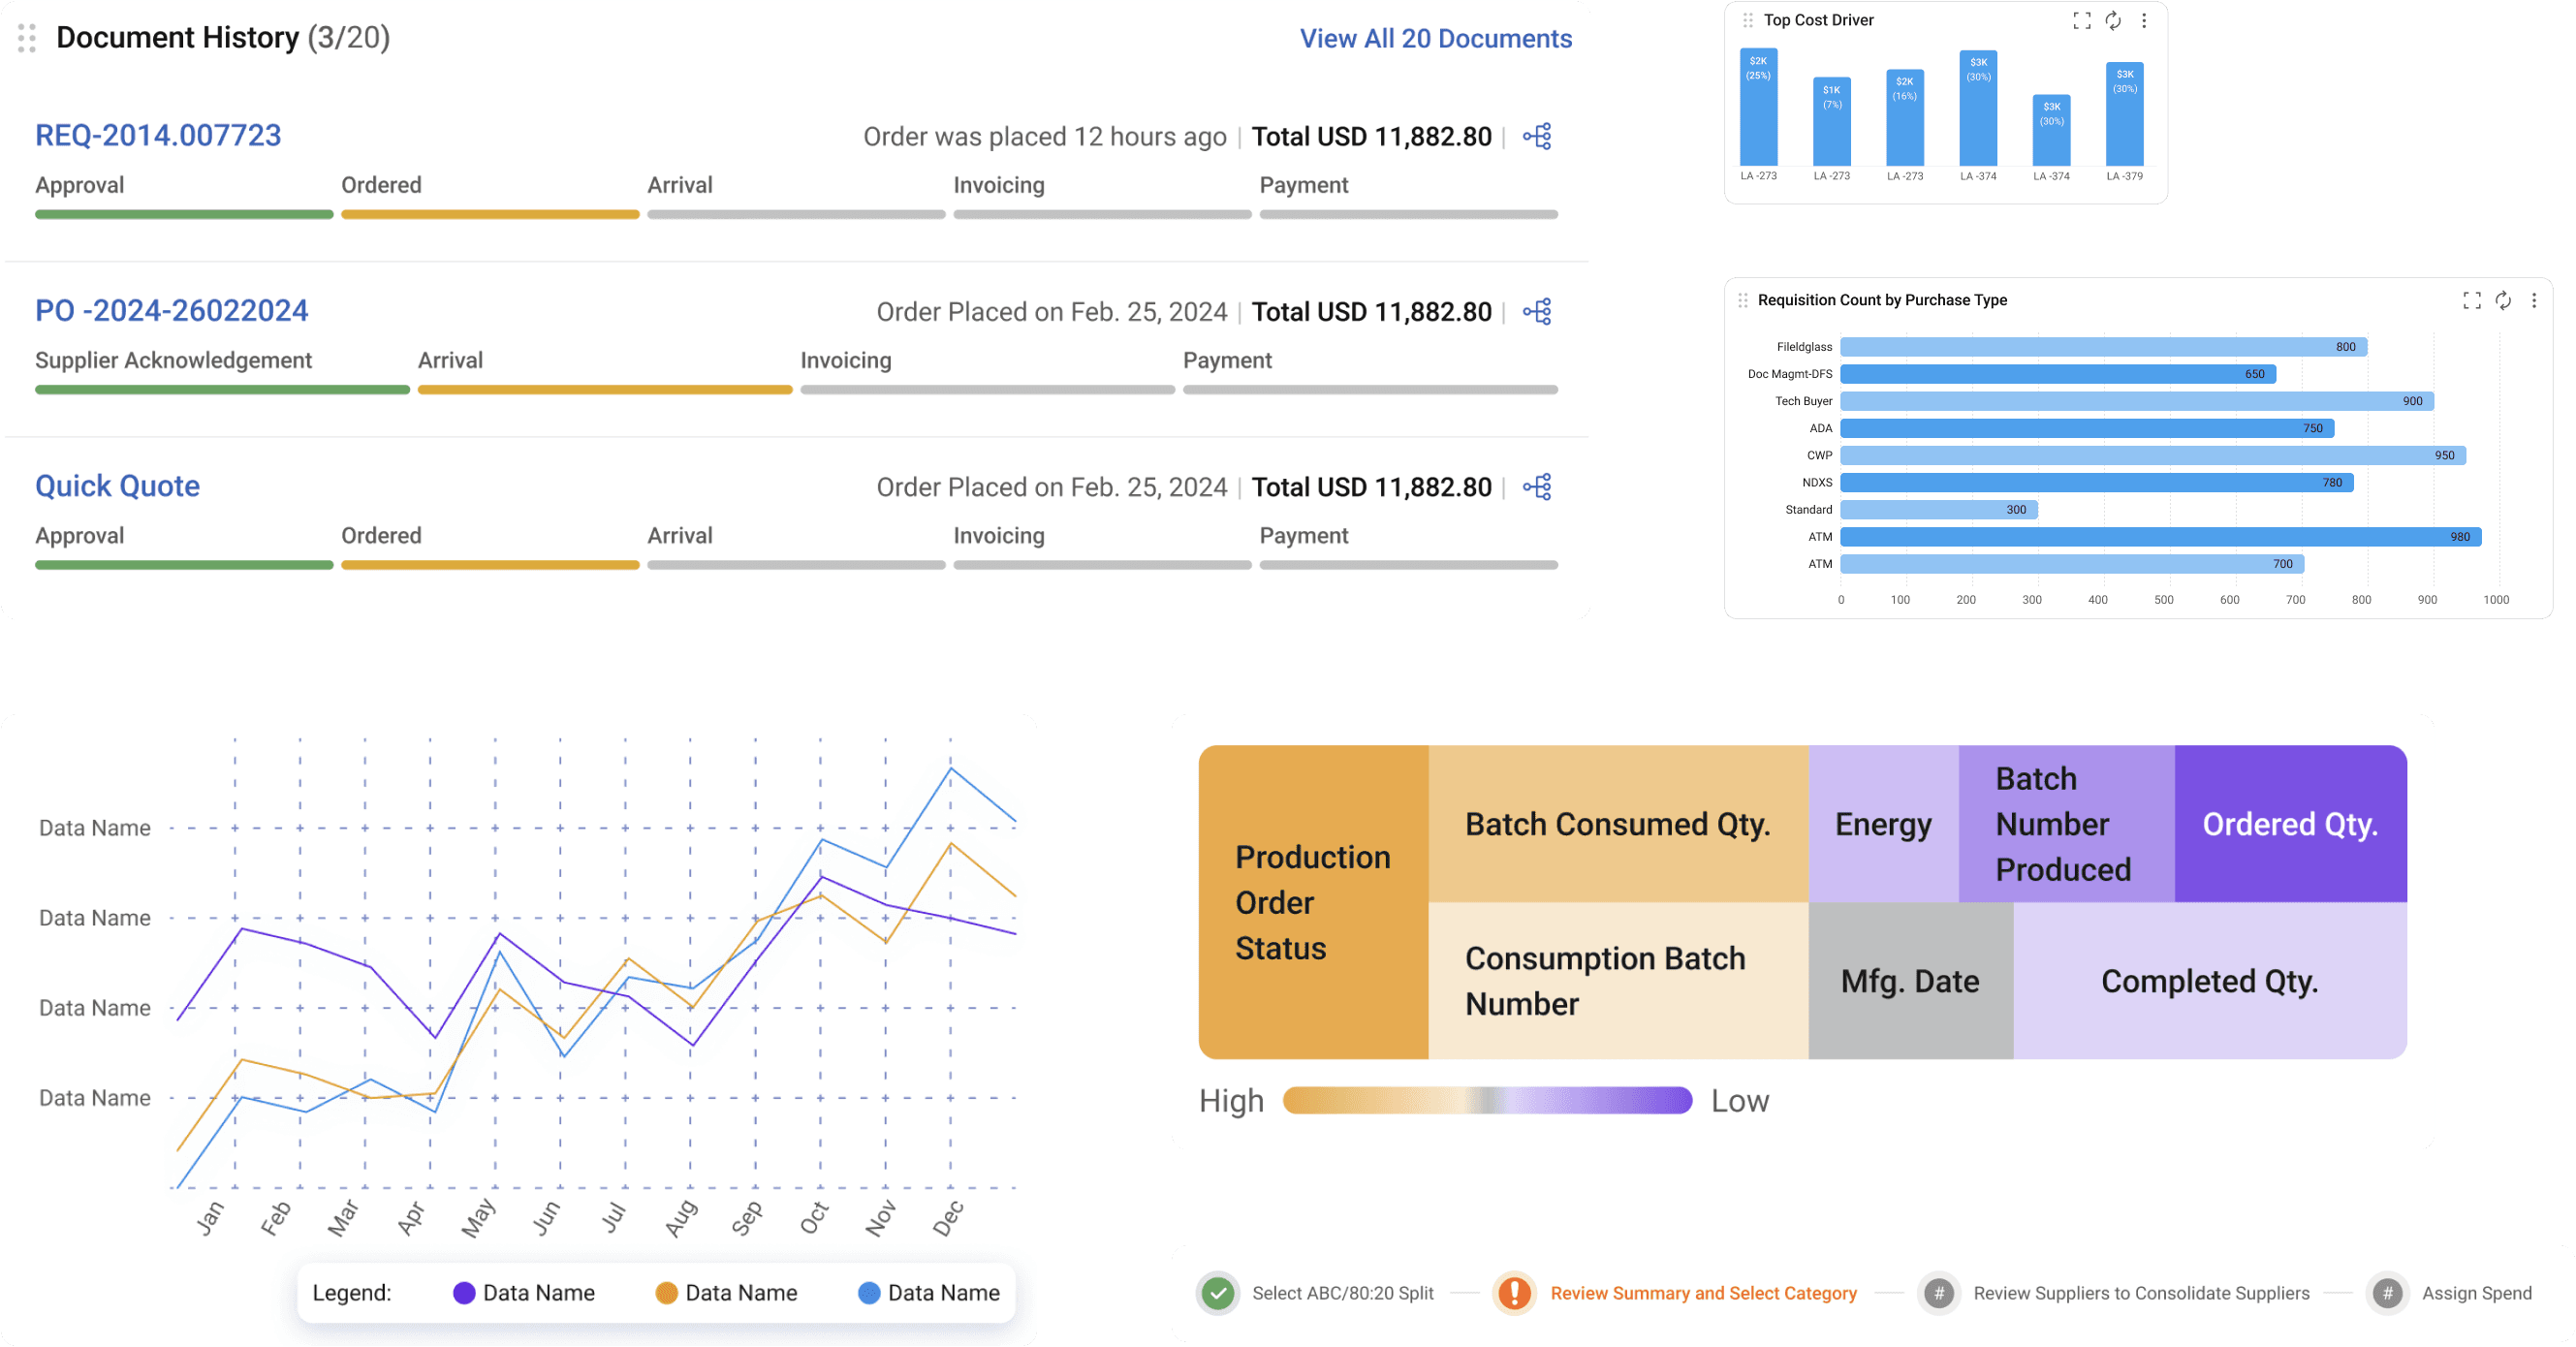
In this project, I led the design of a microchart dashboard for GEP, a supply chain management company. My role was to drive the user experience research, design the component structure, collaborate with developers, and ensure smooth integration across multiple products. The aim was to create an intuitive and visually compelling dashboard that met the specific needs of NEXXE's users while offering scalability and adaptability for future use cases.
Platform Design Process
User needs Microcharts for quick revenue insights in analytics, with real-time hover values and trend-highlighting spark-lines for easy comparison of actual and planned revenue.

Discovery and research
Action
I conducted thorough user research meetings with key stakeholders to understand their needs, challenges, and expectations for the dashboard. Assessed common use cases to identify essential microcharts that required representation on the dashboard. Created user journey maps to record user behaviors, aims, and obstacles, which served as a fundamental basis for designing a thoughtful and user-centric dashboard experience.
Outcome
This research phase helped me deeply understand user needs and paved the way for an effective solution that directly addressed their pain points.

Microcharts Structure
Action
I constructed a methodical arrangement of components to promote a cohesive and easy-to-understand organization within the dashboard's layout, ensuring scalable solutions as new elements get incorporated. Devised a clear-cut strategy for deployment, driven by user necessities, and pinpointed further possible applications where the microcharts could prove to be significant.
Outcome
This phase ensured that the microchart components were aligned with the users’ mental models, setting the groundwork for effective implementation.

Design Components
Action
Crafted eye-catching and uniform component guides that instructed developers about the aesthetics and behavior of every microchart. Collaborated intimately with the development crew to guarantee technical viability and seamless execution of each element, sustaining an ongoing conversation to confront any obstacles.
Outcome
This collaboration with developers was essential in translating design concepts into a functional product, allowing us to achieve consistency across the dashboard.
Product Integration
Action
Oversaw the incorporation of microcharts in over 30 GEP offerings, guaranteeing a consistent user experience. Executed visual quality assessments to confirm that each microchart adhered to the intended standards and worked efficiently across assorted scenarios. Carried out usability discussions to collect opinions from stakeholders, using these findings to continuously modify and enhance the design.
Outcome
The main objective of this phase of integration was to harmonize the experience across a variety of products, guaranteeing a smooth shift for users who interact with multiple platforms.


Validation
How did it go?
I carried out user testing sessions with typical users to verify the microcharts, accumulate feedback, and pinpoint areas needing enhancement. I refined the design guided by user inputs, making certain that the dashboard catered to NEXXE's users' requirements and offered an uninterrupted user experience.

Tips for Platform Design
Effective Communication = Positive Outcomes
Regular feedback sessions and open communication channels with stakeholders helped align expectations and ensure that the final product met the user’s needs.
Deep Dive into Your Products
Understanding the GEP products and NEXXE’s specific use cases enabled me to create a user-centered solution that addressed their unique requirements.
Teamwork: Your Best Allies
Close collaboration with developers was crucial in addressing technical constraints early and maintaining consistency throughout the implementation process.
Scalable and Flexible Platform Development
The component structure was designed with scalability in mind, allowing future modifications without compromising the dashboard’s integrity.
Small Wins = Big Impact
Regularly iterating on feedback allowed us to make continuous improvements, resulting in a more polished final product that exceeded user expectations.